Files
Make sure to check out the basic config for traefik before you continue here.
/opt/docker/proxy/
├── -rw-r--r-- docker-compose.yml
├── secrets
│   ├── -rw------- acme.json
│   └── -rw------- hetzner_key
└── traefik
    ├── -rw------- dynamic.yaml
    └── -rw------- static.yaml
docker-compose.yaml
The docker-compose file will be changed to include grafana and prometheus.
version: "3.9"

networks:
  proxy:
    external: true
  metrics:
    external: false

secrets:
  hetzner:
    file: ./secrets/hetzner_key

services:
  traefik:
    image: traefik:2.9
    container_name: traefik
    restart: always
    secrets:
      - hetzner
    environment:
      - TZ=Europe/Berlin
      - HETZNER_API_KEY_FILE=/run/secrets/hetzner
    volumes:
      - /etc/localtime:/etc/localtime:ro
      - /var/run/docker.sock:/var/run/docker.sock:ro
      - ./traefik/static.yaml:/etc/traefik/traefik.yaml
      - ./traefik/dynamic.yaml:/dynamic.yaml
      - ./secrets/acme.json:/acme.json
    ports:
      - "80:80"
      - "443:443"
      - "127.0.0.1:8080:8080"
    networks:
      - proxy
      - metrics

  prometheus:
    image: prom/prometheus:latest
    container_name: prometheus
    restart: always
    volumes:
      - "./prometheus:/etc/prometheus"
    expose:
      - 9090
    networks:
      - metrics

  grafana:
    image: grafana/grafana:latest
    container_name: grafana
    restart: always
    user: "1000"
    environment:
      - GF_LOG_LEVEL=error
      - GF_SERVER_ROOT_URL=https://metrics.example.de
      - GF_LIVE_ALLOWED_ORIGINS=https://metrics.example.com
    volumes:
      - ./grafana:/var/lib/grafana
    labels:
      - "traefik.enable=true"
    expose:
      - "3000"
    networks:
      - proxy
      - metrics
static.yaml
Change the traefik static configuration to include the metrics settings.
---
metrics:
  prometheus: {}
Grafana setup
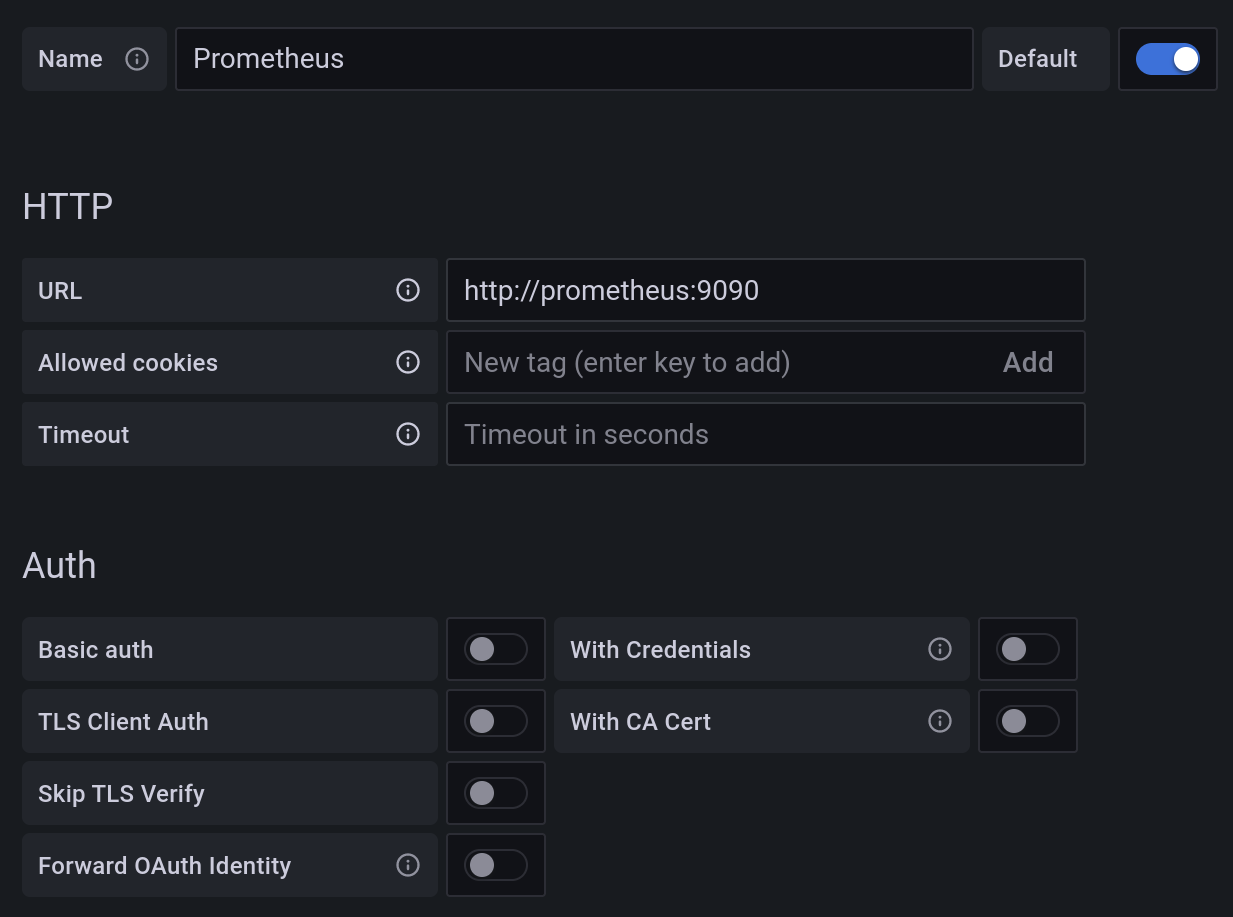
Open grafana on the published domain https://metrics.example.de.
Add the prometheus data source like shown here:
To display stats you can use the official traefik dashboard